4 Debugging R code
This chapter’s structure follows the excellent debugging-chapter from Advanced R11.
Another excellent source for debugging in RStudio is this blog post by Jonathan McPherson.12
4.1 Tracing errors
4.1.1 Traceback
Let’s consider the previously showed function example with a missing variable:
# Ensure that z is missing
if (exists("z")) {
  rm(z)
}
g <- function(x) {
  return(x + z)
}

f <- function(x,y = g(x)) {
  if (x>0) {
    return(x)
  } else {
    return(y)
  }
}
f(-1)
## Error in g(x): object 'z' not found
This example is available here: missing-variables.R.
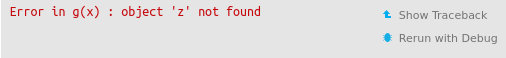
Opening the file with RStudio and sourcing the file will return the following kind of an error:
Now clicking the Show traceback-button will expand the traceback:
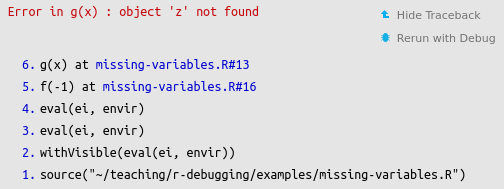
This view will quickly show that the error comes from the g(x)-function call in line #13.
Sometimes lazy evaluation can make reading the call stack complicated. Let’s have a few additional functions that are called in the argument definition:
i <- function() {
return(z)
}
h <- function() {
return(i())
}
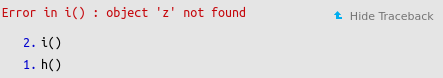
f(x=-1, y=h())
## Error in i(): object 'z' not found
Error is raised by i(), but looking at the call stack it almost looks like f() is somehow involved. This is because value of h() is evaluated only when it is needed in f(). Writing the code like this would reveal the true culprit:
h_value=h()
## Error in i(): object 'z' not found
f(x=-1, y=h_value)
## Error in f(x = -1, y = h_value): object 'h_value' not found
Of course, this is not something you want to do generally. Lazy evaluation is good for speeding up your code, so doing changes like this should be limited to situations where you’re unsure which function causes the error.
4.1.2 Traceback outside of RStudio editor
If you run the code in R console in RStudio or in a separate interpreter you might not get the Show Traceback-prompt.
In those situations you can use the traceback()-function to get the trace. You can try it out with the following test in the console:
f(-1)
traceback()
You can also set the R error handling to call traceback on errors:
backup_options <- options()
options(error=traceback)
f(-1)
options(backup_options)
Here we also took a backup of the default options. This is usually a good idea as changing options will change the options for the whole R session.
4.2 Interactive debugger
4.2.1 Launching debugger with RStudio’s “Rerun with Debug”
RStudio can launch you a debugger at the location where the error occured. If you source the file again and launch the debugger with Rerun with Debug, you’ll get an interactive debugger that looks something like this:
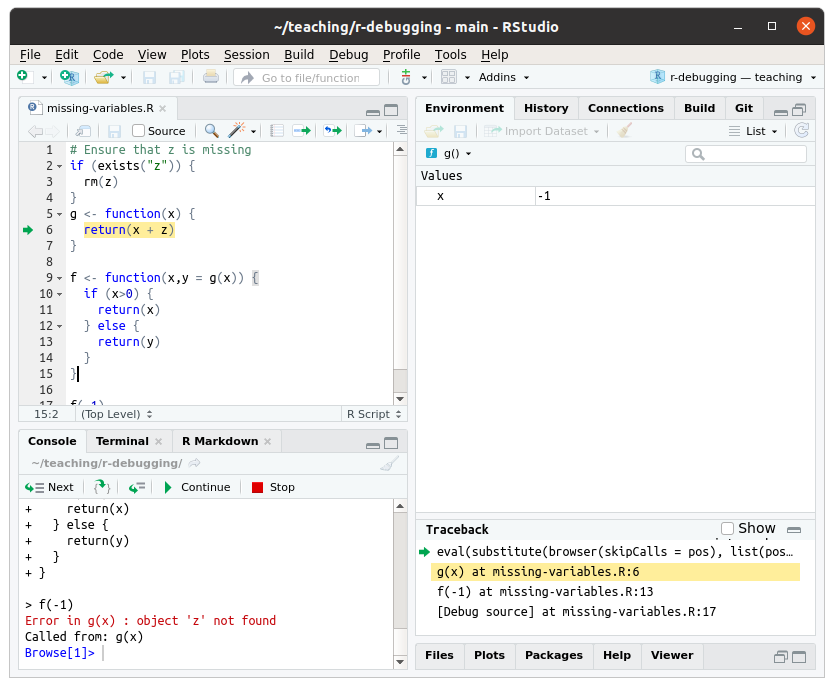
This view has many areas of interest:
- On the top left RStudio will open the source code of the problematic function and it tries to highlight the line that causes the error.
- On the top right we have an environment browser that shows what variables are defined inside
the
g()-function’s environment. - On the bottom right we have the traceback of the erroneous function call. The function we’re investigating is highlighted.
- On the bottom left we have the interactive debugger open in the console.
4.2.2 Debugger commands
The interactive debugger console has multiple commands (more info available here):
- Continue,
corcont: Exit the browser and continue execution at the next statement. - Finish,
f: Finish execution of the current loop or function - Help,
help: Print this list of commands - Next,
n: Evaluate the next statement, stepping over function calls. For byte compiled functions interrupted by browser calls, n is equivalent to c. - Step,
s: Evaluate the next statement, stepping into function calls. Again, byte compiled functions make s equivalent to c. - Where,
where: Print a stack trace of all active function calls. - Resume,
r: Invoke a “resume” restart if one is available; interpreted as an R expression otherwise. Typically “resume” restarts are established for continuing from user interrupts. - Quit,
Q: Exit the browser and the current evaluation and return to the top-level prompt.
RStudio also has a toolbar in debugger console with buttons for next (n), step (s), finish (f), continue (c) and stop (Q).

Figure 4.1: RStudio debugger toolbar. Source: Advanced R
In addition to these commands one can run arbitrary R-commands to list variables, test their values etc.
4.2.3 debug and debugonce
You can also launch debugger from the console with debug()- and debugonce()-functions.
debug(f) will set a permanent flag that will cause a debugger to be launched whenever
function f is called. You can unset this variable with undebug.
Alternatively, you can use debugonce to launch the debugger once for a function. This is
especially useful if the function you want to debug is inside a for-loop. You can try this with the following:
debugonce(g)
f(-1)
4.3 Launching browser in code
One can also launch the interactive browser by specifying browser() is the code:
g_browse <- function(x) {
  browser()
  return(x + z)
}
f(-1, y=g_browse(x))
This is very useful when you’re writing new code and you want to check what the function does line-by-line.
4.4 Setting breakpoint in editor
In RStudio editor you can also set a temporary breakpoint by clicking to the left of the line number.
This will put a red dot next to the line number. This is a break point which will acts like a browser()-call.
Setting breakpoints is even faster way of debugging code while you’re developing it.
4.5 Launching debugger with recover()
You can also launch the debugger when an error occurs by setting the error option to use recover():
option(error=recover)
f(-1)
options(backup_options)
Again, we’ll want to restore the previous settings once we’re finished.
You can also set a similar behaviour in RStudio by checking Debug -> On Error -> Break in Code from the top menu.
RStudio will try to limit the debugger launching to functions that are written by you. In some cases, e.g. if you give wrong arguments to a packaged function, this will result in a situation where you do not get a debugger when you want it. To bypass RStudio’s check, you’ll need to uncheck Use debug error handler only when my code contains errors in Tools -> Global Options -> General.
4.6 More tools for interactive debugging
There are plenty of more tools like trace, utils::setBreakpoint() etc. See debugging-chapter from Advanced R for more information on these.
4.7 Non-interactive debugging
Non-interactive usage is most common when one wants to run R code in a remote system, a virtual machine or a container. When running R code non-interactively it is usually a good idea to verify that the R installation is as similar as possible to the interactive session.
Using tool such as renv can make
it easier to replicate the same environment by storing the list of required packages
into a renv.lock-file.13
Other things such as different package loading order, forgetting to load a package explicitly or setting some variables outside of the code into the environment can also create problems.
4.7.1 Print debugging
Print debugging is an age old debugging paradigm that usually works. Few well placed
cat- or print- statements can usually tell a lot about the inner workings of the
program.
More advanced logging packages such as logger14, lgr15 or log4r16 can be very useful as well as you can leave many debug statements in your code, but print them only when needed.
One can also utilize R’s save-function to save environment variables for further inspection.
4.7.2 dump.frames()
dump.frames() allows you to do a recover() on a code that was run non-interactively by
saving the state of the program on error. One can then use interactive debugger() to look
into the failed program state.
The following example from the relevant section on Advanced R illustrates the idea perfectly:
# In batch R process ----
dump_and_quit <- function() {
  # Save debugging info to file last.dump.rda
  dump.frames(to.file = TRUE)
  # Quit R with error status
  q(status = 1)
}
options(error = dump_and_quit)

# In a later interactive session ----
load("last.dump.rda")
debugger()
Hadley Wickham, Advanced r (CRC press, 2019), https://adv-r.hadley.nz.↩︎
Jonathan McPherson, “Debugging with the RStudio IDE,” 2021, https://support.rstudio.com/hc/en-us/articles/205612627-Debugging-with-RStudio.↩︎
Kevin Ushey, Renv: Project Environments, 2022, https://rstudio.github.io/renv/.↩︎
Gergely Daróczi, Logger: A Lightweight, Modern and Flexible Logging Utility, 2021, https://daroczig.github.io/logger/.↩︎
Stefan Fleck, Lgr: A Fully Featured Logging Framework, 2021, https://s-fleck.github.io/lgr/.↩︎
John Myles White and Aaron Jacobs, Log4r: A Fast and Lightweight Logging System for r, Based on Log4j, 2021, https://github.com/johnmyleswhite/log4r.↩︎